mission
The mission of art @ the Nawn is to provide a welcoming, and inclusive space for performance artists to teach, and create works; and to make art and community in greater Boston accessible to all through public events and cultural enrichment.
the Nawn Factory program goals
the city
served population
The team at the Nawn monitors our data to evaluate how well we fulfill our project mission. We break it down by the numbers here. We focus on cities within thirty minutes of our building by public transit, believing that these communities are most likely to regularly engage with our programming.
We rely on two sources for information: publicly available census data and self reported demographic information. We do not independently survey the public for general information, nor do we require program participants to offer more than the minimum needed to satisfy membership.
However we also ask program participants to voluntarily identify their economic information to better understand who uses our services. In exchange, we offer senior discounts and participate in the Card to Culture 5 program to lower barriers to entry for qualified participants.
| population | percentage | |
|---|---|---|
| Boston | 675,647 | 64.97 |
| Brookline | 63,191 | 6.08 |
| Cambridge | 118,403 | 11.39 |
| Quincy | 101,636 | 9.77 |
| Somerville | 81,045 | 7.79 |
| total | 1,039,922 |
Focusing on cities within thirty minutes of our building on public transit, the area population was 1.04M as of the 2020 census 4 .
We focus on communities with 30 minute public transit access to the Nawn Factory building, although we also recognize the value of our position at the exit of a major interstate highway, and walking distance to a regional commuter train station 6 with service to the south shore of Massachusetts. Although we can reasonably attract customers from within a thirty minute driving radius, we have not included them in this calculation.
| median | per capita | low income | |
|---|---|---|---|
| Boston | $97,344 | $61,698 | 16.6 |
| Brookline | $142,101 | $96,682 | 8.7 |
| Cambridge | $130,748 | $78,723 | 12.8 |
| Quincy | $98,882 | $54,982 | 10.6 |
| Somerville | $132,572 | $73,940 | 9.8 |
| average | $66,060 |
Although our five target communities have similar household median incomes, Boston has the largest overall population, but also the largest percentage of residents living below a defined low income line at 16.6% of residents according to the US Census Bureau. For example, the low income line 1 can be defined as a family of four earning $32,649.
We expect a fair number of low income residents to actually be undergraduate students who often have scholarships or external family support. While they are also a worthy population, as a publicly funded project we also want to make special efforts to attract low income families with children. Our goal is to ensure that we offer inclusive programming and services to residents across the income spectrum and that all visitors can enjoy our programming.
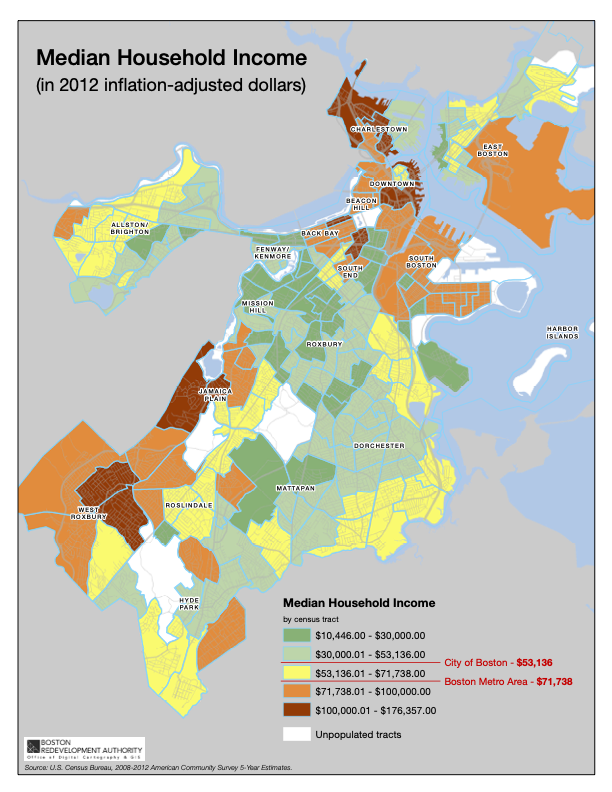
The map breaks out median household incomes by district, and points to a concentration of the lowest two income quintiles in Allston, Mission Hill, Roxbury, Dorchester and Mattapan.
We focus on Boston with the visual map, because each city maintains a breakdown of census data specific to their respective constituents. Boston is the closest and the most populous city in our service area, so this data serves as a reasonable proxy for summarizing the others.
the neighborhood
Roxbury and Dorchester
A core part of our mission is serving the communities of Roxbury and Dorchester. They are geographically the closest to our facility, but are also the most underserved communities for artistic enrichment according to the Metropolitan Area Planning Council 2 in their area inventory 3 .
| total | youth | |
|---|---|---|
| Dorchester | 123,056 | 22,261 |
| Roxbury | 56,800 | 8,468 |
| Brighton | 55,869 | 2,440 |
| East Boston | 46,892 | 6,123 |
| Fenway | 42,351 | 732 |
| Jamaica Plain | 42,949 | 5,451 |
| South Boston | 40,904 | 3,045 |
| South End | 34,582 | 3,417 |
| Hyde Park | 33,469 | 6,191 |
| Allston | 31,810 | 1,445 |
| West Roxbury | 31,381 | 5,608 |
| Roslindale | 29,378 | 4,636 |
| Mattapan | 24,424 | 4,630 |
| Mission Hill | 19,000 | 1,671 |
| Back Bay | 18,983 | 788 |
| Charlestown | 19,232 | 2,868 |
| Downtown | 15,752 | 411 |
| North End | 10,635 | 226 |
| Beacon Hill | 9,327 | 545 |
| West End | 9,306 | 491 |
| Seaport | 8,289 | 203 |
| Chinatown | 6,371 | 715 |
| Longwood | 5,553 | 58 |
Our home communities in Roxbury and Dorchester along with Brighton have among the highest raw populations in the city. Within these, Dorchester, West Roxbury and Hyde Park host the highest numbers of youth with that trend continuing in the southern two thirds of the city.
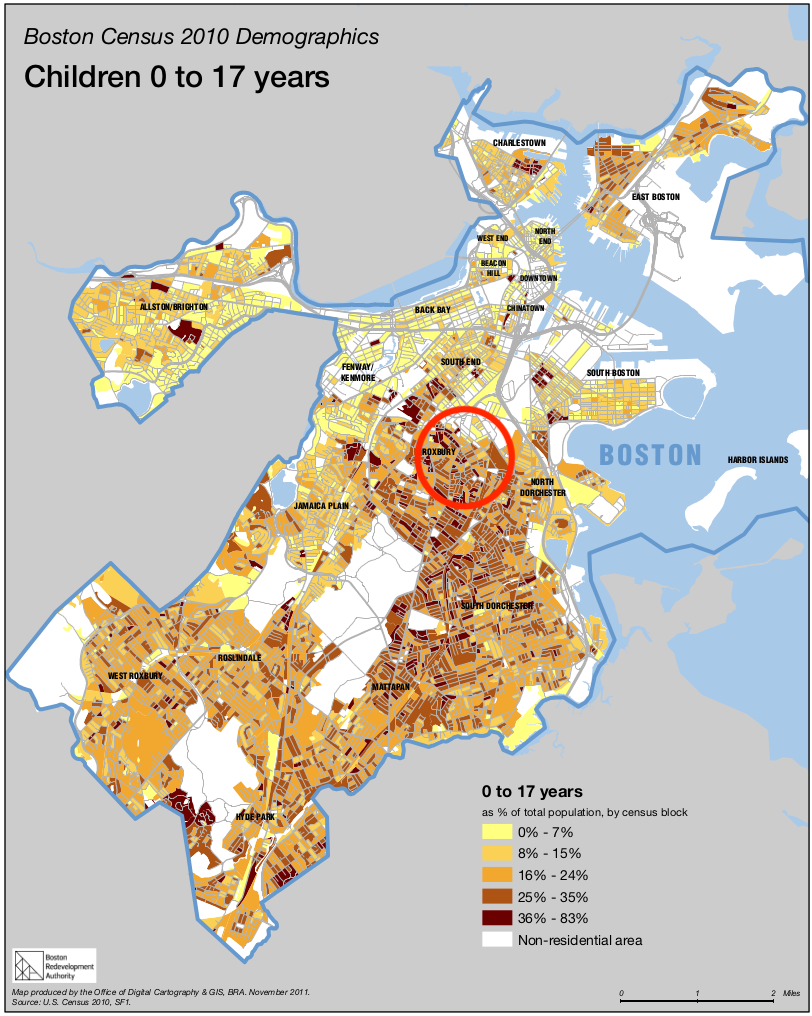
The census demographic map shows a concentration of families with children, and a higher per capita ratio of children in Roxbury, Dorchester, Mattapan and Hyde Park.
the goals
The sum total of all of our research is that our project can have the greatest impact by actively seeking to serve youth and low income residents with affordable and inclusive programming. At the time of our founding, recent research by MAPC indicates a visible lack of art spaces in the most densely populated and underserved areas of the city, and our team is well positioned to reach them.
art @ the Nawn is geographically positioned near a local and regional transit hub in an area with a relatively high concentration of youth, seniors and low income households. While we can reasonably attract visitors from across the income spectrum and from approximately 30 minutes of public transit to the building, our immediate neighbors may likely fall into one of our three target categories.
-
accessible program pricing
art @ the Nawn was born of a public disposition process where local residents voted for what they most wanted to see, and who was most likely to deliver it. We are thankful to have been selected, and so have integrated those early commitments into the core of our mission.
While serving low income residents is a laudable goal for the public benefit, for us that is purely coincidental. We make our programs affordable and accessible, because there is no art @ the Nawn without their support.
-
family friendly engagement
Families often seek programming that the whole family can participate in. This can take the form of guided activities, performances or block parties, but our project can maximize public engagement by creating an intergenerational space where youth, parents and elders can all find content to enjoy.
-
activation of the public sphere
We believe that communities need to reclaim the public sphere. That is where we are most likely to meet our neighbors, find fulfillment and where our children are most likely to make lifelong friends.
Public activations are really the outward expression of our success at our other goals. Our ability to stage public events such that whole neighborhoods can come out their front doors to laugh, play and build community together is directly informed by how comfortable local residents and youth feel with the presence of our project.
Do you have questions about the project or the content of this report? Get in touch at theProject@theNawn.org.
We love to talk about our work, and hope that this information can lead lead to more successful, community driven projects in the
future.
You can also take our survey, and tell us which programs are most interesting to you. We want to include your voice in designing the future
of arts and culture in our community. Tell us what you think.
Jon Smalls is the director of art @ the Nawn. He is passionate about the role the Nawn plays as a community organization, and focuses on art as enrichment but also art as a tool for civic engagement and social expression.
He is always up to talk about music, the communities he loves, and his latest library holds. Follow him and his writing for more of his brand of dry humor blended into hot takes on life in the big city.
more by this author- "Poverty Thresholds by Size of Family and Number of Children" United States Census Bureau 2026 January 15 2026 April 24 https://www.census.gov/data/tables/time-series/demo/income-poverty/historical-poverty-thresholds.html
- "Making Space for Art: Securing Cultural Infrastructure in Boston, Cambridge & Somerville" Metropolitan Area Planning Council 2026 April 24 https://www.mapc.org/resource-library/making-space-for-art/
- "Making Space for Art: Securing Cultural Infrastructure in Boston, Cambridge & Somerville: Creative Spaces" Metropolitan Area Planning Council 2026 April 24 https://make-space-for-art-61278629e27d.herokuapp.com/
- "2020 Census Results" United States Census Bureau 2024 August 21 2026 April 24 https://www.census.gov/programs-surveys/decennial-census/decade/2020/2020-census-results.html
- "Card to Culture" Mass Cultural Council 2026 April 24 https://massculturalcouncil.org/organizations/card-to-culture
- "Ruggles station Information" Massachusetts Bay Transportation Authority 2026 April 24 https://www.mbta.com/stops/place-rugg
- "Boston Population Estimates 2025 Neighborhood Level" Boston Planning & Development Agency 2025 November 4 2026 April 24 https://data.boston.gov/dataset/2025-boston-population-estimates-neighborhood-level
- "QuickFacts Quincy city, Massachusetts; Brookline CDP, Massachusetts; Somerville city, Massachusetts; Cambridge city, Massachusetts; Suffolk County, Massachusetts; Boston city, Massachusetts" United States Census Bureau 2026 April 24 https://www.census.gov/quickfacts/fact/table/quincycitymassachusetts,brooklinecdpmassachusetts,somervillecitymassachusetts,cambridgecitymassachusetts,suffolkcountymassachusetts,bostoncitymassachusetts/INC110224